
Ethernut 3 Source Code Debugging
This document explains how to setup Eclipse and OpenOCD to allow source code debugging of Nut/OS applications running on Ethernut 3. It is assumed, that you are already familiar with creating Nut/OS applications. The Nut/OS Software Manual describes the required steps.
This document has been originally written for Nut/OS 4.9 beta. Additional comments had been included later to cover Nut/OS 4.10.
Note, that you don't need to use Eclipse to create your own Nut/OS applications. You favorite text editor is just fine to create the source code and building your application can be done on the command line.
The same is true for debugging. There are a number of alternative tools available, like GDB for the command line purists or Insight, which provides a GUI for GDB. Actually, Eclipse uses GDB too, but provides a nicely integrated user interface for editing, compiling, uploading and debugging Nut/OS applications. While based on Java, it is available on all major platforms.
One last word before you move on: If you got here, because you assume that either your application or any of the Nut/OS libraries contains a bug, you should carefully think about, whether source code debugging will really help. Multithreaded network applications often fail because of timing problems or racing conditions. Setting breakpoints and inspecting variables will seldom help to find such bugs. What you need is some sort of tracing. In its most simple form, you can use the devDebug device to let your program output additional information on the serial port while running. In almost the same way you can use syslog. A similar situation may occur, when parts of memory are overwritten by bad pointers or buffer overflows. You should consider other debugging methods provided by Nut/OS, which are explained in the chapter Error Handling of the Nut/OS Software Manual.
Requirements
This is a short listing only. For Details please refer to the related manuals.
Required Hardware
- Ethernut 3 Board
- Turtelizer 2 JTAG Dongle
- PC with USB and RS-232 port
- 12V Power Supply
- RS-232 DB9 Null Modem Cable
- USB A/B Cable
The first 2 items you can build yourself, using the Eagle 4.11 CAD files for Ethernut 3.1 and Tutelizer 2.0. Readily built and tested devices are available at www.egnite.de/en/egnite-shop.html and from several distributors.
Required Software (Windows)
The following software needs to be installed on the Windows PC:
- Windows XP or later
- Java Runtime Environment 1.6 or later
- Eclipse Platform Runtime Binary 3.6.2 (Helios)
- Eclipse CDT 7.0.2
- TeraTerm or similar Terminal Emulator
- Nut/OS 4.10
- Turtelizer OpenOCD Package
- Turtelizer FTDI Driver
You can download the Java Runtime at www.oracle.com/technetwork/java/javase/downloads.
Eclipse is available at download.eclipse.org/eclipse/downloads and the CDT can be found at www.eclipse.org/cdt. Remember to install the Platform Runtime Binary. You may try Eclipse IDE for C/C++ Developers, which includes the CDT, but this version is not covered here.
TeraTerm can be downloaded at ttssh2.sourceforge.jp.
The last 3 items are available at our download page.
Installation details can be found in the documents that come with the specific product.
Required Software (Ubuntu)
The following software needs to be installed on the Linux PC (tested with Ubuntu 10.10):
- Java Runtime Environment 1.6 or later
- Eclipse Platform Runtime Binary 3.7 (Helios)
- Eclipse CDT 7.0.2
- minicom or other Terminal Emulator
- gcc-arm-elf
- Nut/OS 4.10
- Turtelizer OpenOCD Package
You can install the Java Runtime Environment, minicom and openocd with the following command:
apt-get install default-jre minicom openocd
Eclipse is available at download.eclipse.org/eclipse/downloads and the CDT can be found at www.eclipse.org/cdt Remember to install the Platform Runtime Binary. You may try Eclipse IDE for C/C++ Developers, which includes the CDT, but this version is not covered here. Also the eclipse package of Ubuntu doesn't work.
Installation details can be found in the documents that come with the specific product.
Configuring Nut/OS
When using the latest YAGARTO distribution, you must be aware of a significant change. While earlier releases used arm-elf-gcc, YAGARTO is now using arm-none-eabi-gcc. While Nut/OS 4.10 should work with this environment out of the box, Nut/OS 4.9 has been prepared to make this switch easy. Open the file nut/Makevars.arm-gcc with your text editor. Locate the line
#TRGT = arm-none-eabi-
and remove the leading numero sign:
TRGT = arm-none-eabi-
Save your changes.
In order to include debugging information in the compiled binaries you need to switch from arm-gcc to arm-gccdbg. When done, rebuild Nut/OS and recreate the application directory. The following steps will give detailed instructions.
The screenshots were taken while running the wxWidgets version of the Nut/OS Configurator. In Nut/OS 4.10, this tool had been replaced by Qt based version. Thus, the images will slightly differ from your screen output.
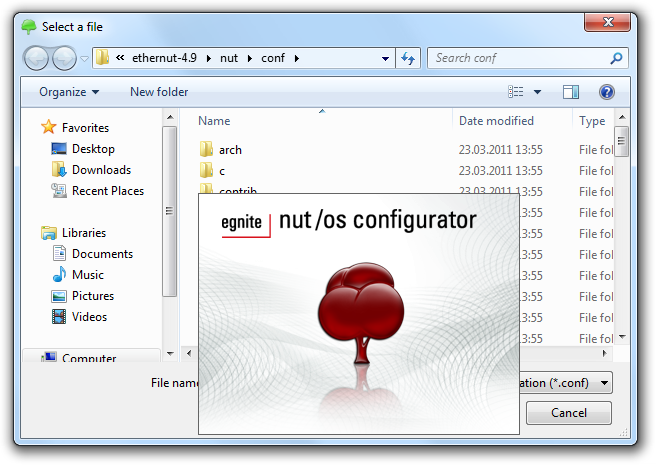
When started for the first time, the Nut/OS Configurator will display a file selection dialog. If this is hidden by the splash window, simply click on that window to close it.
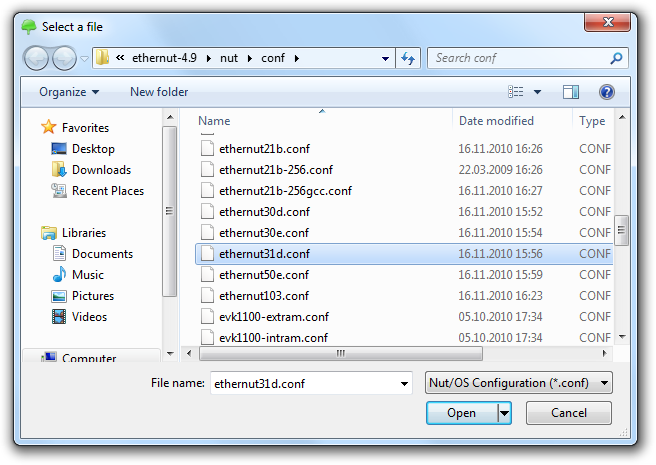
Select the file ethernut30e.cfg for Ethernut 3.0 boards or ethernut31c.cfg for Ethernut 3.1 boards and click Open.
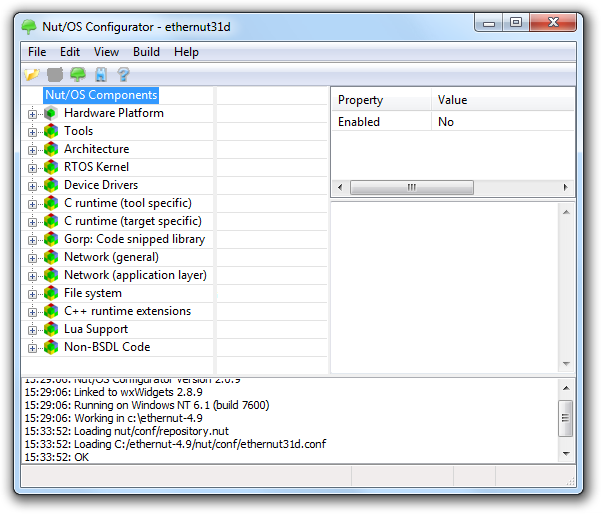
The Configurators main window will show the Nut/OS Components in a tree structure on the right side.
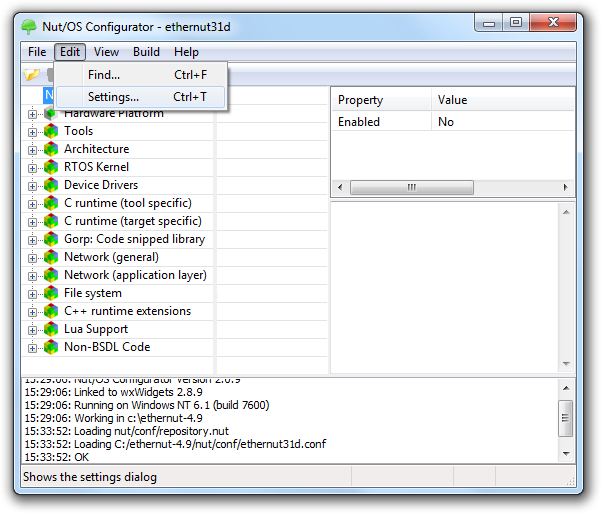
From the Edit menu select Settings....
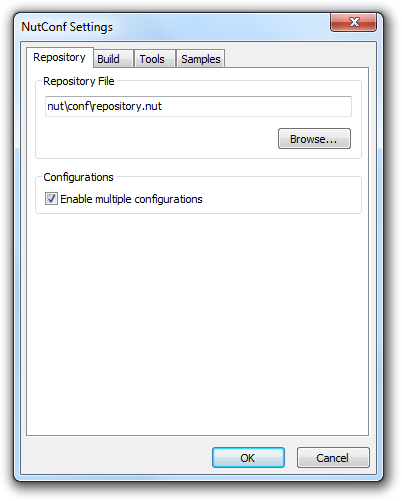
Nothing needs to be changed on the Repository page of the settings dialog. You may check Enable multiple configurations if you are concurrently working with different target boards.
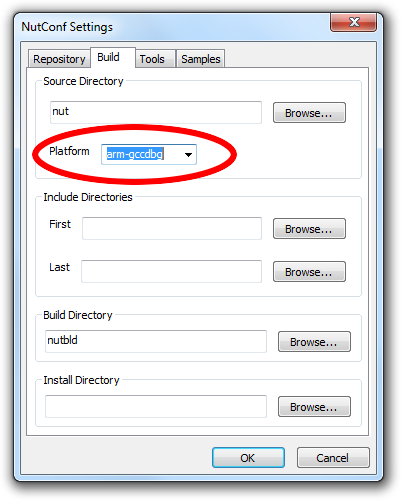
Select arm-gccdbg as the platform on the Build page.
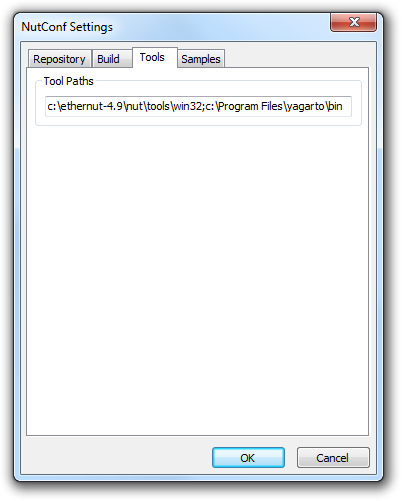
On the Tools page you need to enter the path to all required tools, separated by semicolons. For the Ethernut 3 board this should point to the Nut/OS win32 tools directory and the YAGARTO bin directory. While all other settings use normal slashes in paths, here we must use backslashes. If you are using Linux and the compiler is in a standard path, you don't need to insert a path here.
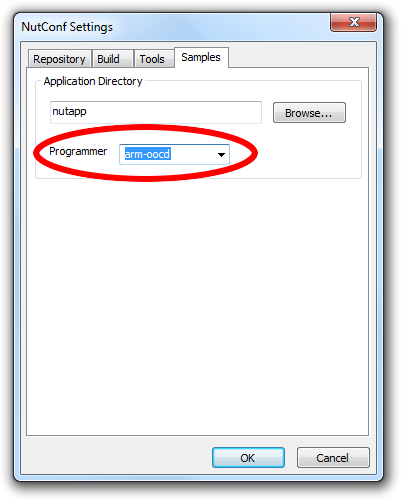
On the last page titled Samples you may select arm-oocd as the programmer of choice, but this is only required for programming the flash memory, not for debugging in RAM.
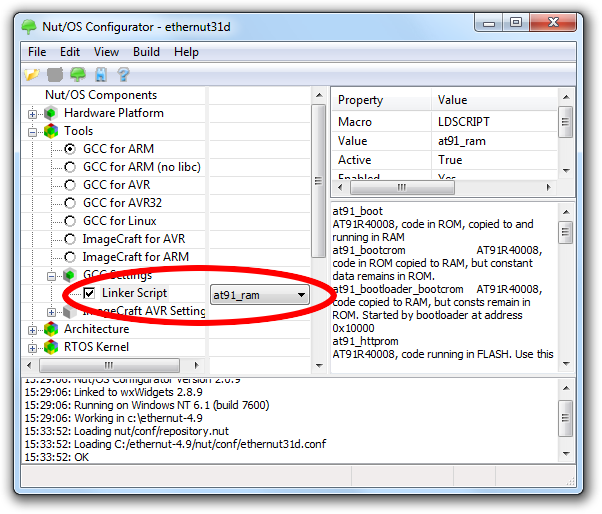
Before building the system, change the Linker Script in the components tree under Tools/GCC Settings to at91_ram.
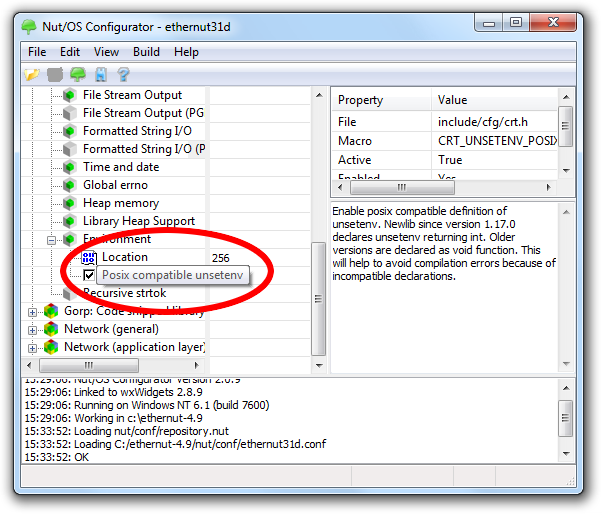
We are using YAGARTO with Newlib 1.19. Make sure that Posix compatible unsetenv is checked under C runtime (target specific)/Environment.

Now we are ready to build Nut/OS for debugging. Select Build Nut/OS in the Build menu.
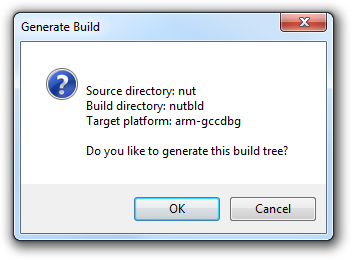
A message box shows the settings for creating the build directory. Verify them and click OK to build this directory.
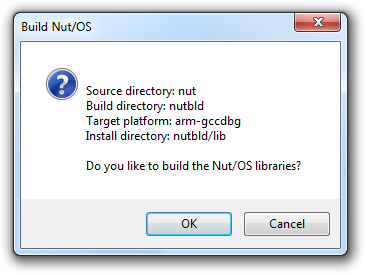
The wxWidgets version of the Configurator will show a second message with the settings for building the system. Again verify them and click OK.
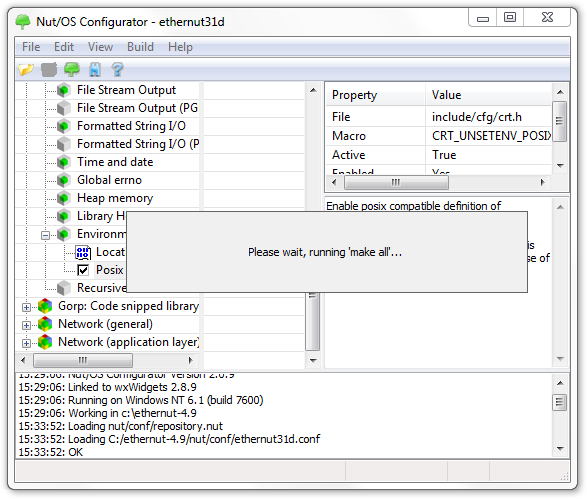
The build may take a few minutes.
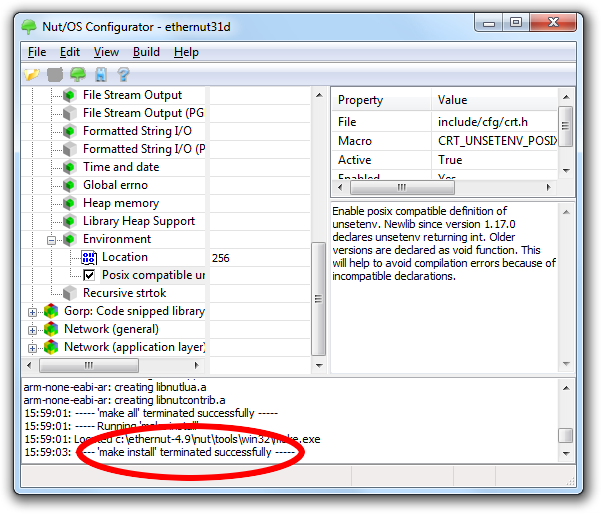
When done, make sure that it has been terminated successfully.

Nut/OS uses a separate directory for the application code. A template can be created by selecting Create Sample Directory, containing all Nut/OS samples that are included in the distribution. Remember, that we will use the events sample.
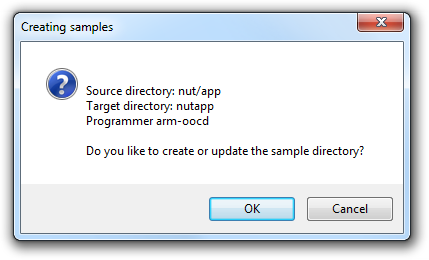
When runnign the wxWidget based Configurator, a message box will show the current settings. Click OK, if everything looks as expected.

When done, you may exit the Configurator by selecting Exit in the File menu.
Configuring Eclipse
It is assumed that you successfully installed Eclipse and the CDT plug-in. For a first demonstration we will use the events sample that is included in the Nut/OS distribution.
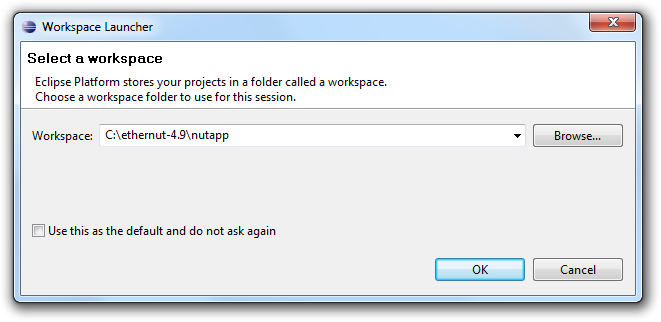
When started, Eclipse will ask for the Workspace Path. Choose the Nut/OS sample directory, e.g. C:\Ethernut-4.10\nutapp.
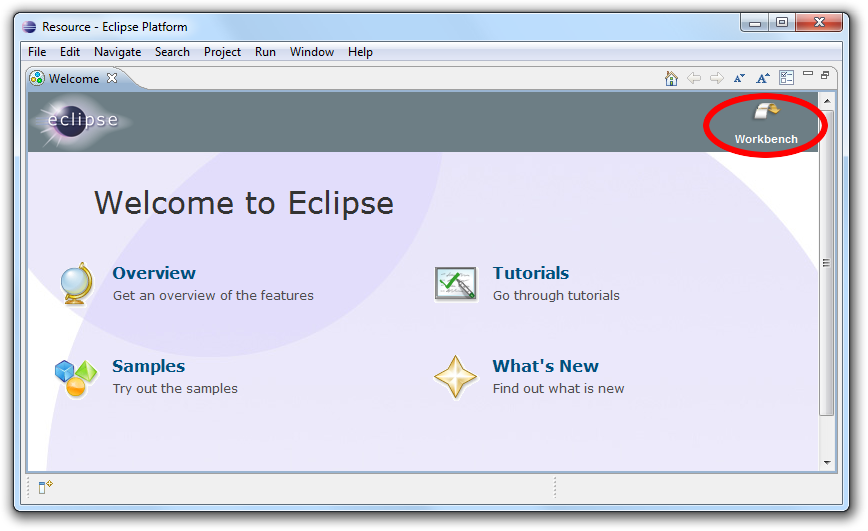
The welcome page appears. Click on Workbench in the upper right corner.
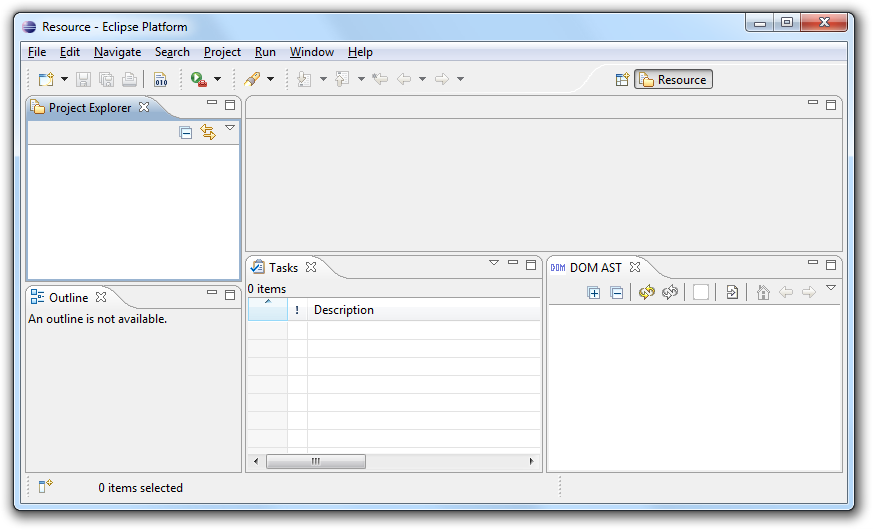
The so called Resource Perspective or, depending on what else had been installed on your computer, the Java Perspective appears. We will later change to the C Perspective.
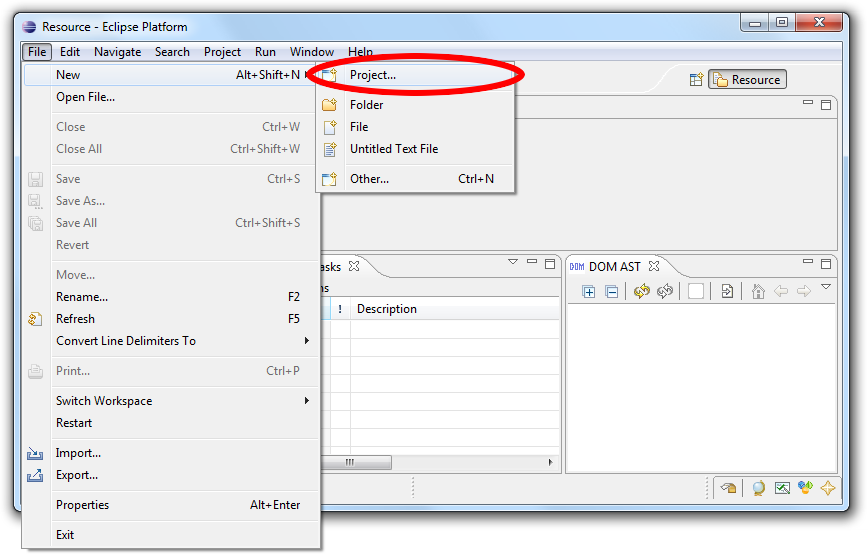
In the File menu select New and Project....
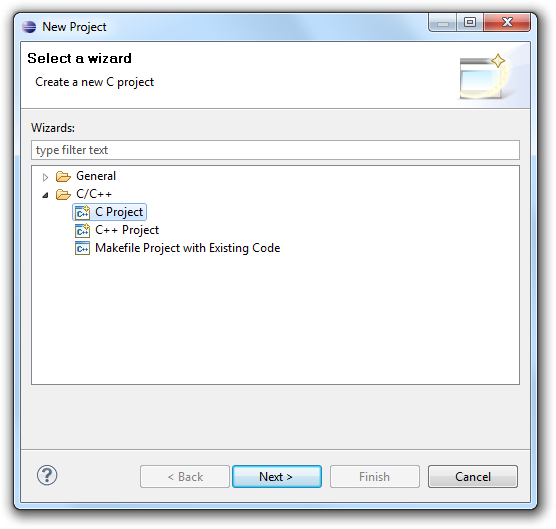
In the New Project dialog choose C Project and click on Next.
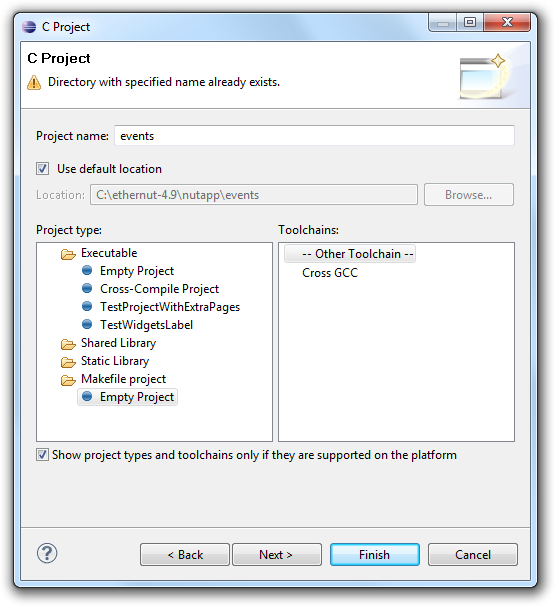
In the C Project dialog enter events for the project name. Then choose Empty Project and -- Other Toolchain --. Again click on Next.
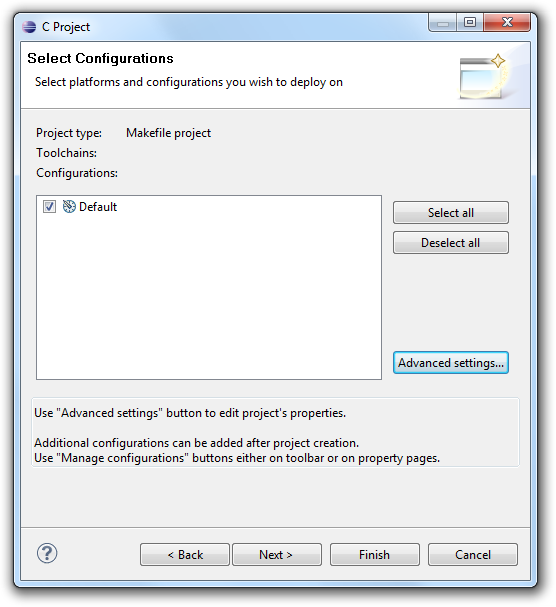
On the next page click on Advanced settings....
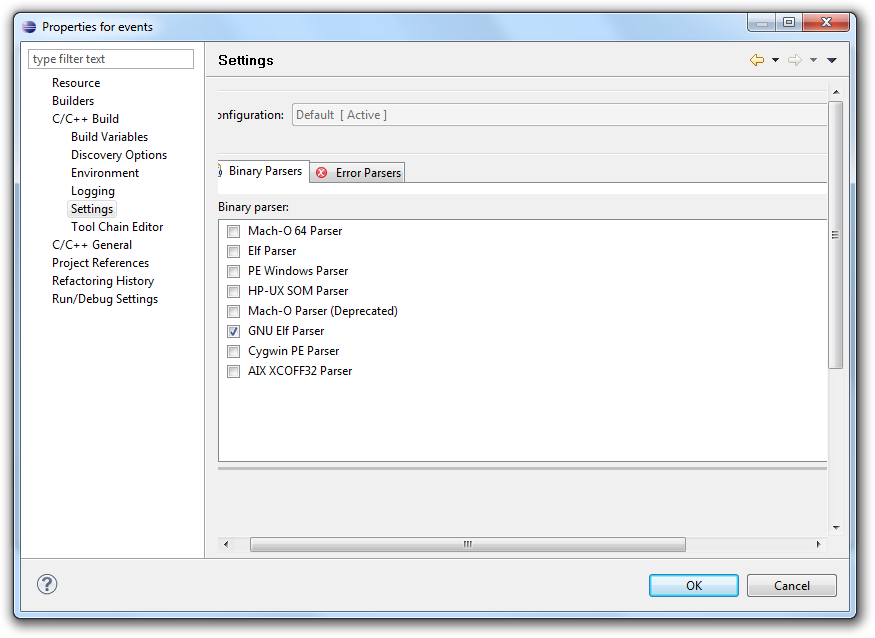
In the Project Properties page select Settings and check GNU Elf Parser. Then click on OK.
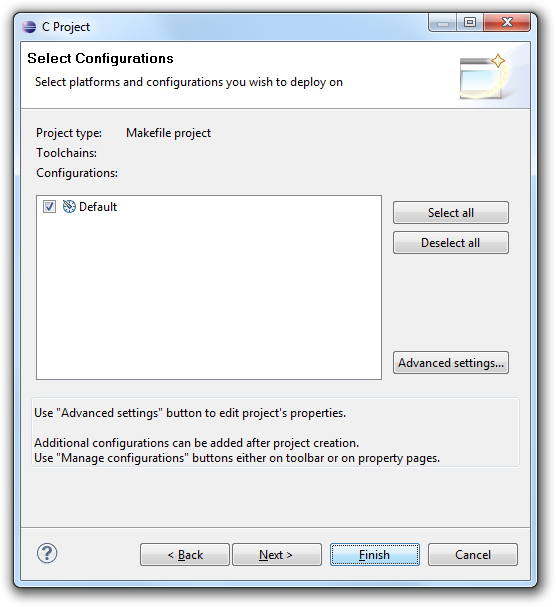
Back in the C Project dialog click Finish.

Click Yes to open the C/C++ perspective.
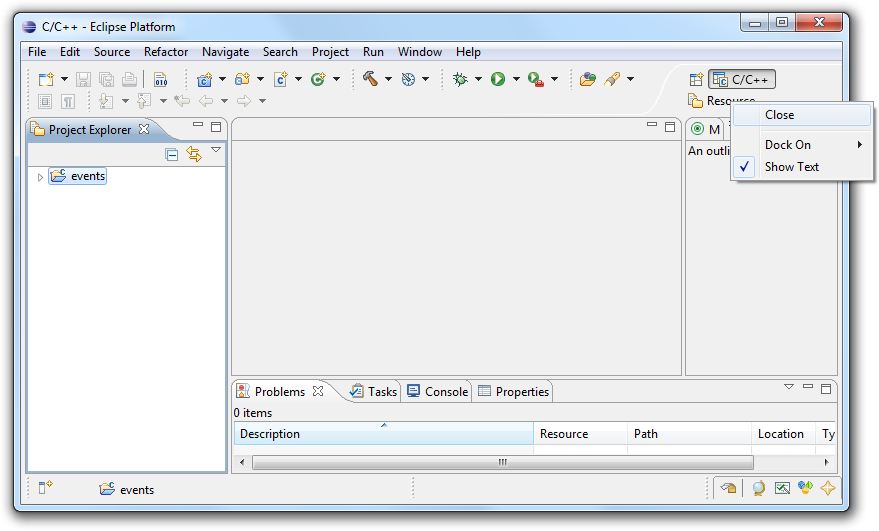
We do not need the Resource or Java Perspective, therefore you should close it.
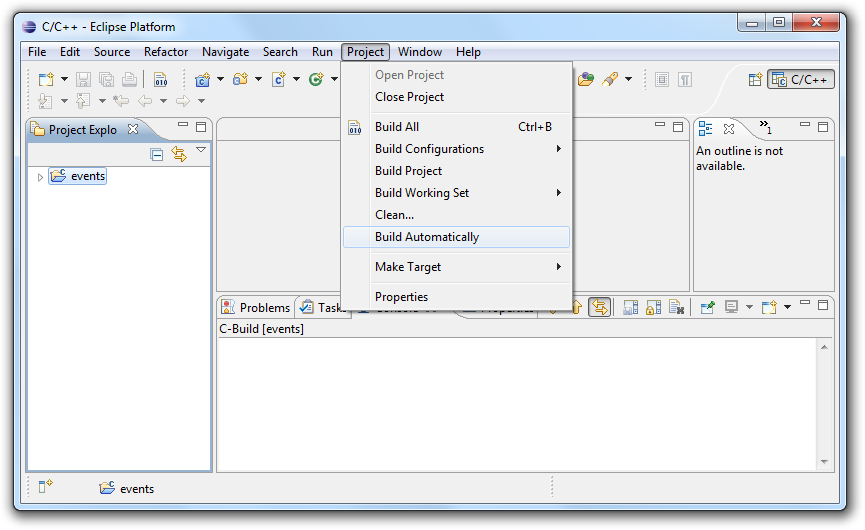
Uncheck Build Automatically in the Project menu.
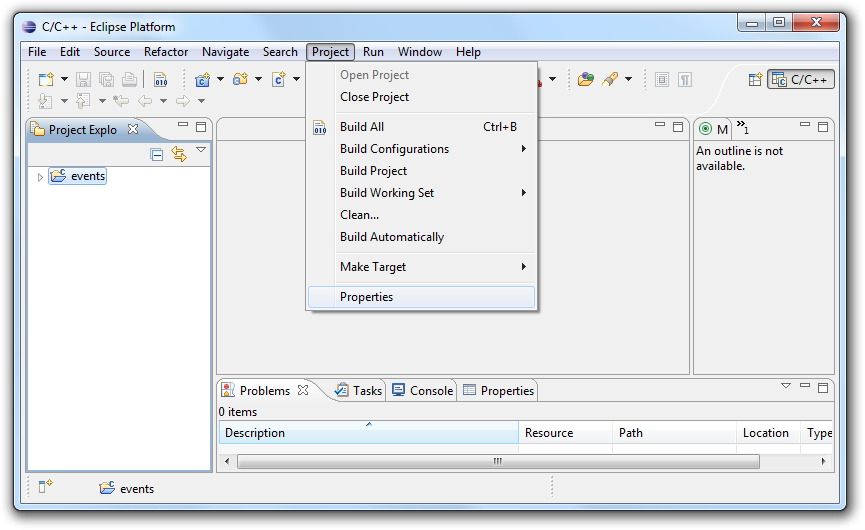
In the same menu select Properties.
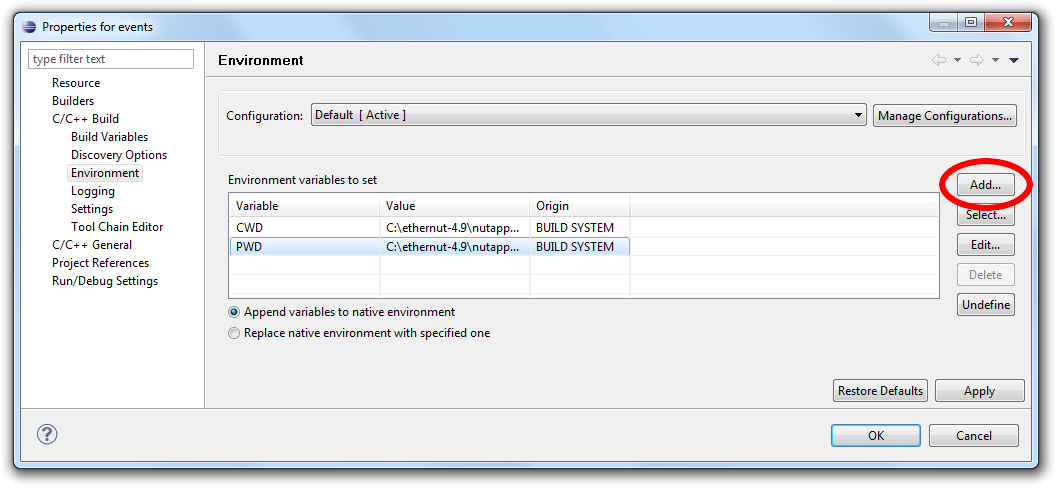
In the Properties dialog select Environment in the tree on the right. Then click Add.
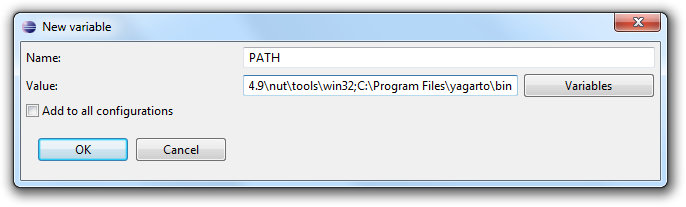
The variable Name must be PATH. You need to enter the path to all required tools as the Value, separated by semicolons. The first path should point to the Nut/OS win32 tools directory and the second one to the YAGARTO bin directory.
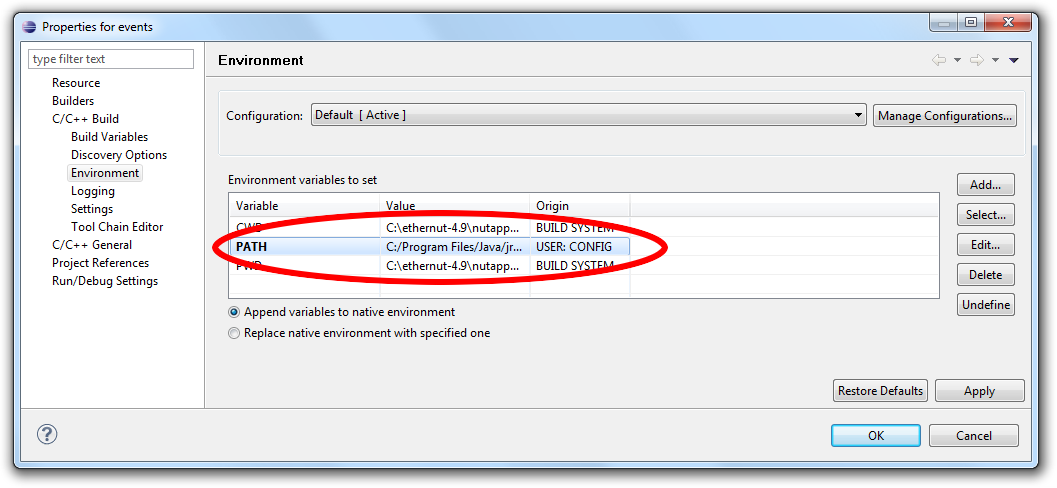
Click OK to store the updated Environment.

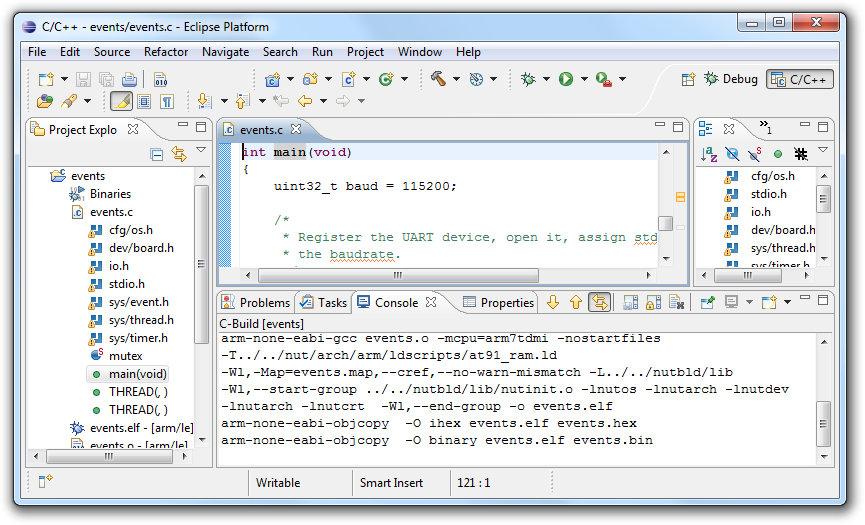
Then, in the same menu, select Build Project.
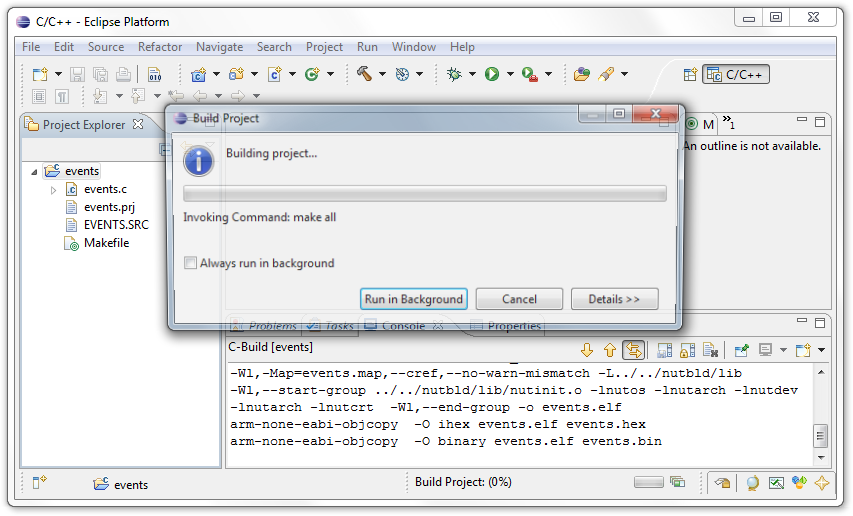
Building this simple application requires a few seconds only.

When done, the newly created files appear in the Project Explorer. The file events.elf contains the executable binary including all debug information.
Debugging the Application
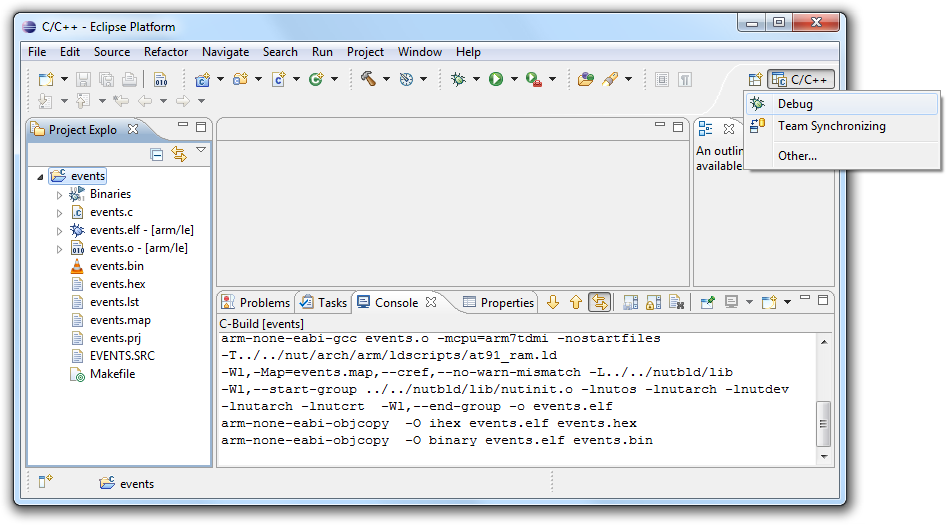
Click on the Open Perspective button  and select Debug. This will
open the Debug Perspective.
and select Debug. This will
open the Debug Perspective.
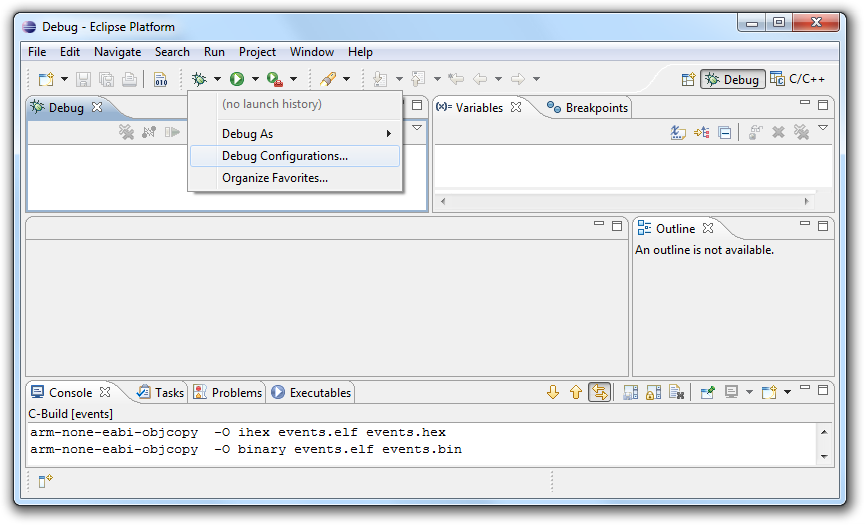
Click on the tiny arrow near the bug  in the toolbar to open the related
menu. Then select Debug Configuration....
in the toolbar to open the related
menu. Then select Debug Configuration....
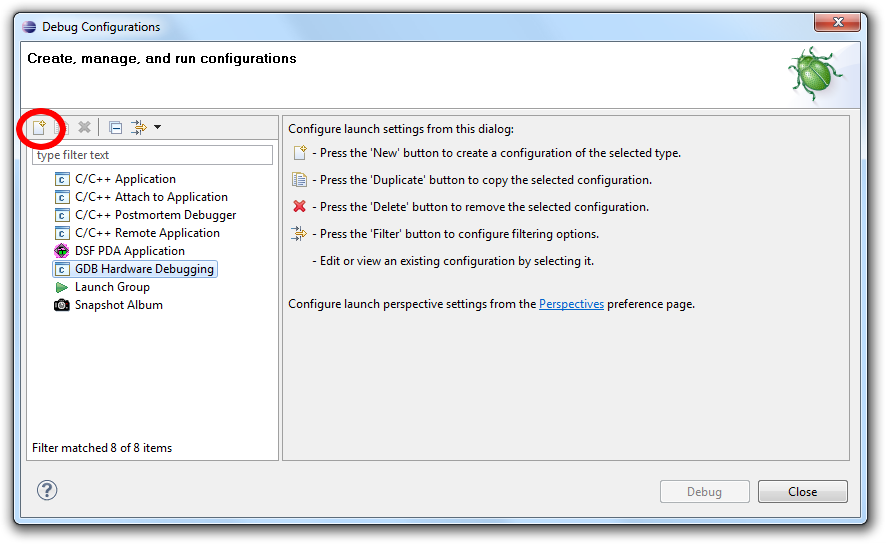
In the Debug Configurations dialog select GDB Hardware Debugging and click on the New button.
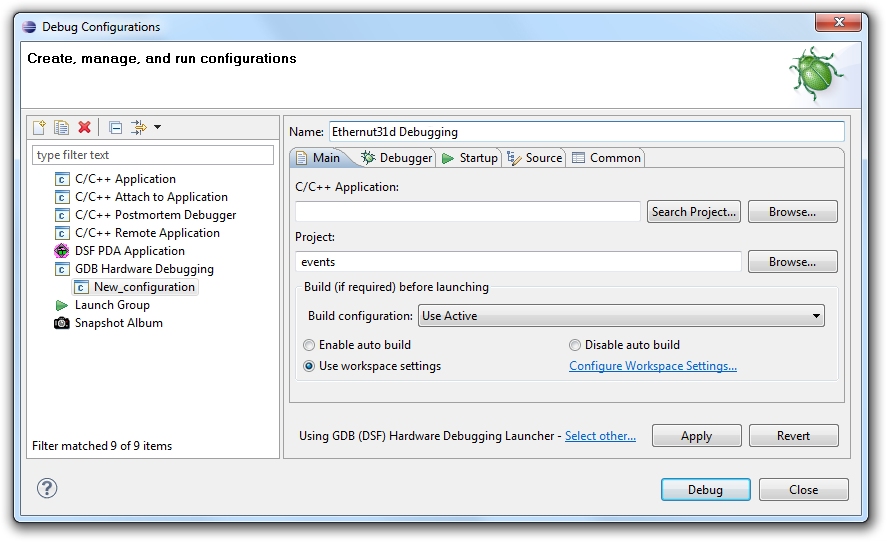
Enter Ethernut31d_Debugging as the configuration name and events as the project name. Next click on Search Project....
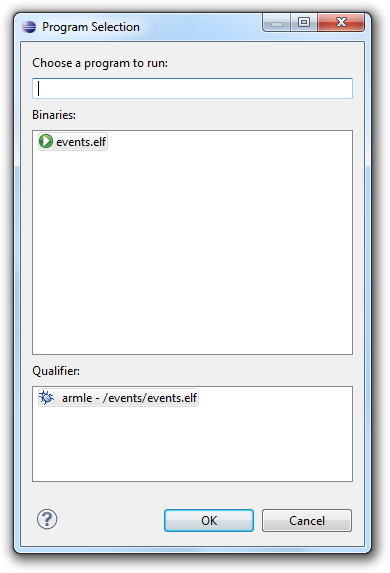
Select events.elf and click OK.

Back in the Debug Configurations dialog click on Select other.
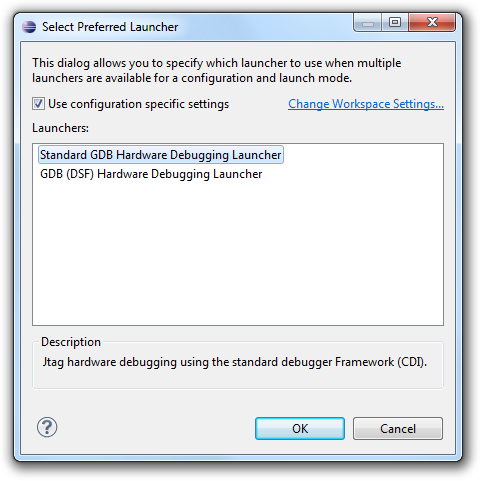
Choose Standard GDB Hardware Debugging Launcher as the preferred launcher and click OK.
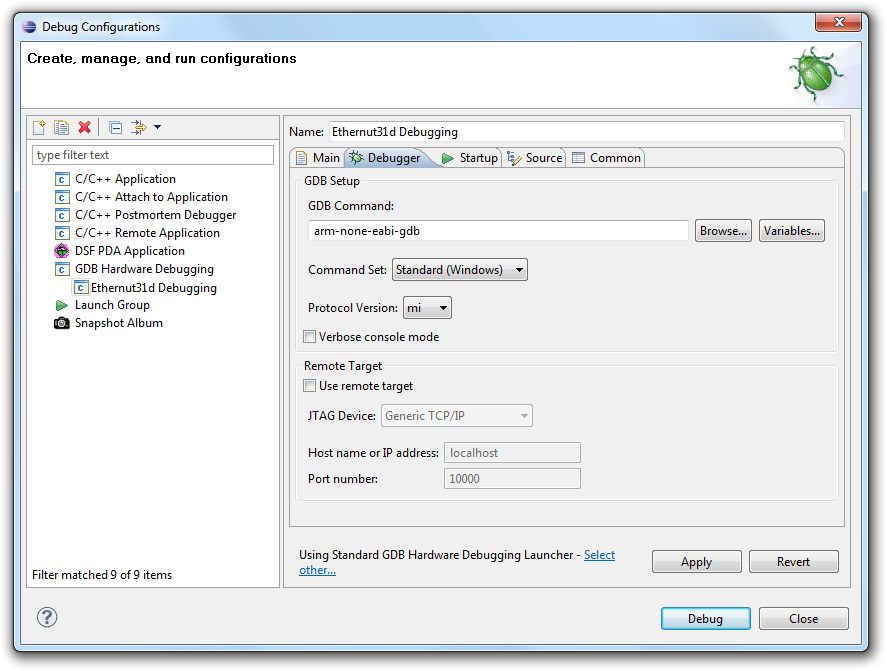
Back in the Debug Configurations dialog click on the Debugger tab and enter arm-none-eabi-gdb in GDB Command. Although we will use remote target debugging, Use remote target must be unchecked here.

Now click on the Startup tab. Set breakpoint at and Resume must be checked. Enter NutInit as the breakpoint target.
Then copy and paste the following commands into the field Initialization Commands.
target remote localhost:3333
monitor reset
monitor sleep 500
monitor poll
monitor soft_reset_halt
monitor gdb_breakpoint_override soft
monitor mww 0xffe00000 0x1000212d
monitor mww 0xffe00004 0x20003025
monitor mww 0xffe00008 0x21002026
monitor mww 0xffe00010 0x22002e3e
monitor mww 0xffe00020 0x00000001
set mem inaccessible-by-default off

Finally click Apply to store the settings and Close to close the dialog.
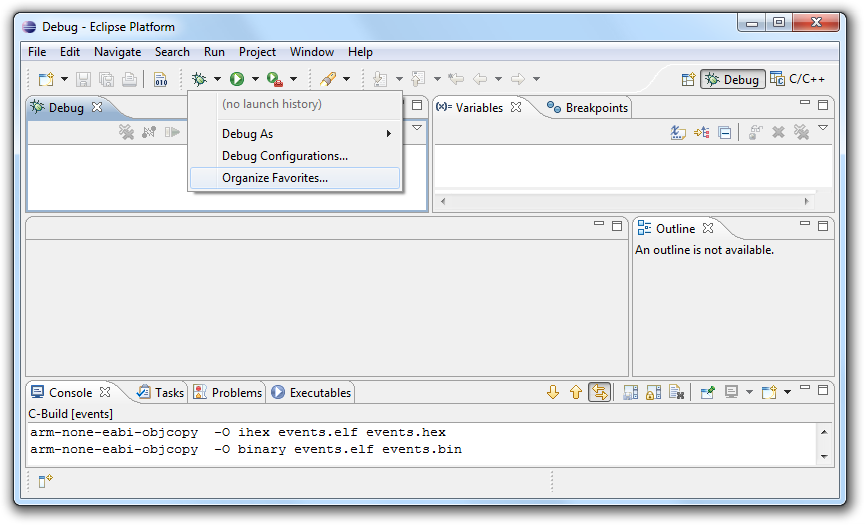
Once again click on the tiny arrow near the bug to open the menu and select Organize Favorites....

Click Add.
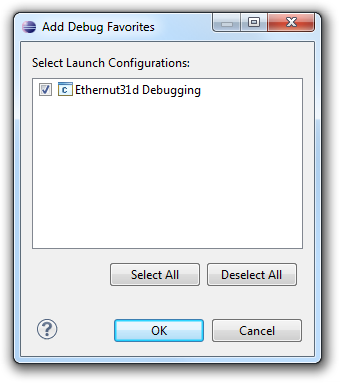
Check Ethernut31d_Debugging and click OK.
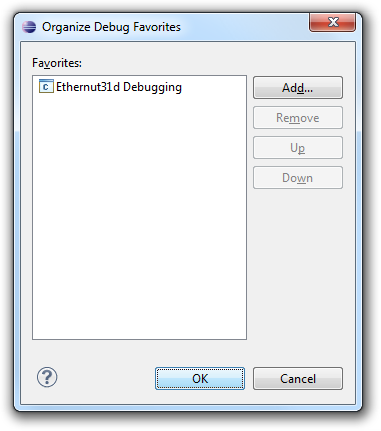
In the previous dialog click OK again.
We will now setup the hardware, using the following steps:
- Connect the Turtelizer's JTAG port to the Ethernut board's 10-pin connector.
- Attach the power supply to the Ethernut Board and switch it on. The red LED should go on.
- Connect the Turtelizer's USB port to the PC using the USB A/B cable.

If the Turtelizer is used for the first time, it will be required to install the FTDI driver. For more details please refer to the Turtelizer's documentation.
Next we will start OpenOCD. We could do this within Eclipse, but for the first time it makes sense to start it manually to check the output in case of problems.
Unfortunately, the standard configuration for OpenOCD will not work out of the box. You can use a simple text editor like Notepad to fix this. Open the file C:\Ethernut-4.10\nut\tools\turtelizer2\board\ethernut3.cfg and put a number sign in front of the following line:
#arm7_9 dcc_downloads enable
Save your change.
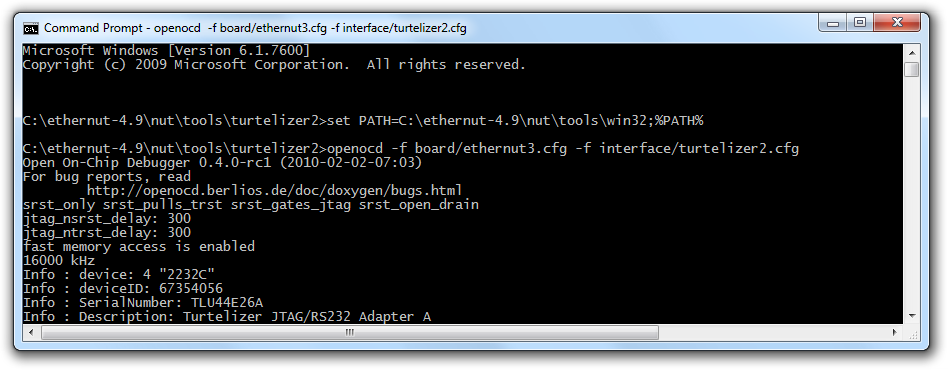
Now open a command line and change to directory C:\Ethernut-4.10\nut\tools\turtelizer2. Add the Nut/OS tools directory for Windows to your path, using the following command
set PATH=C:\ethernut-4.10\nut\tools\win32;%PATH%
Yout don't need to set the path under Linux. Then start OpenOCD using
openocd -f board/ethernut3.cfg -f interface/turtelizer2.cfg
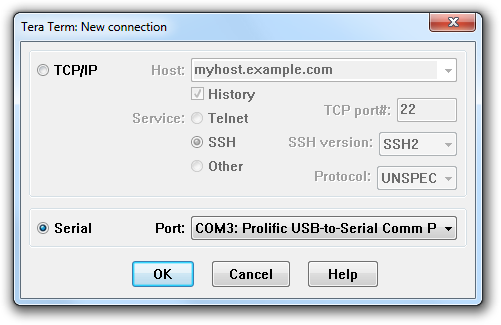
The events sample will create some output on the RS-232. To make it visible, we start a terminal emulator. On Windows PCs we could use HyperTerminal, but TeraTerm is the preferred one. After TeraTerm started, select Serial port... from the Setup menu.
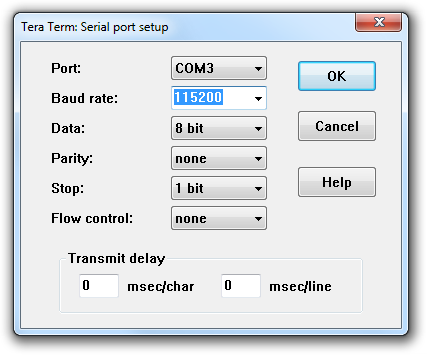
Select the COM port to which the Ethernut board is connected. Configure the port to 8 data bits, no parity, 1 stop bit and no flow control and click on OK.
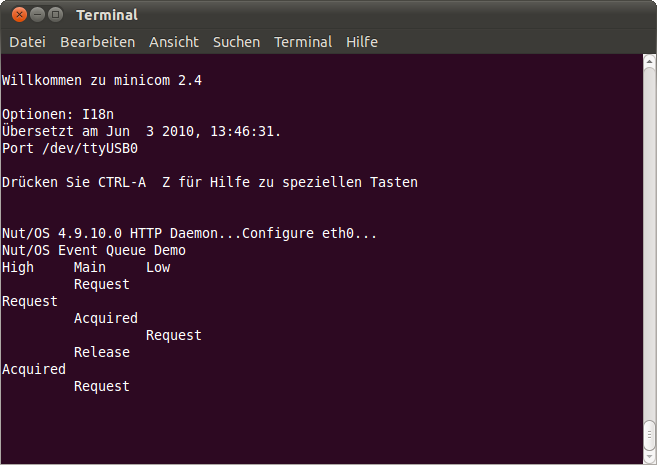
Under Linux you can use the following command on a terminal to start minicom:
minicom -D /dev/ttyUSB0 -b 115200
You need to replace /dev/ttyUSB0 with the correct device.
Let's get back to Eclipse. Remember that we specified a breakpoint at NutInit in the debugger configuration. For some unknown reason the debugger fails, if this is not defined. However, the function NutInit is located in the initialization of Nut/OS, while you will be mostly interested in debugging your application code.
Lets specify a second breakpoint at the beginning of the application code, which is the function main. Click on the tab C/C++ in the upper right corner to change to the C Perspective.
In the Project Explorer double click on the events folder to expand it. Then click on the tiny arrow in front of events.c to expand this part of the tree. Note, that this arrow will appear only when moving the mouse over the Project Explorer window.
Now double click on main(void) to open the source file at this location.

At the first line click with the right mouse button on blue border to open the context menu. Select Toggle Breakpoint.

Switch back to the debug perspective by clicking on the tab Debug in the upper right corner. Click on the bug button in the toolbar to start debugging.
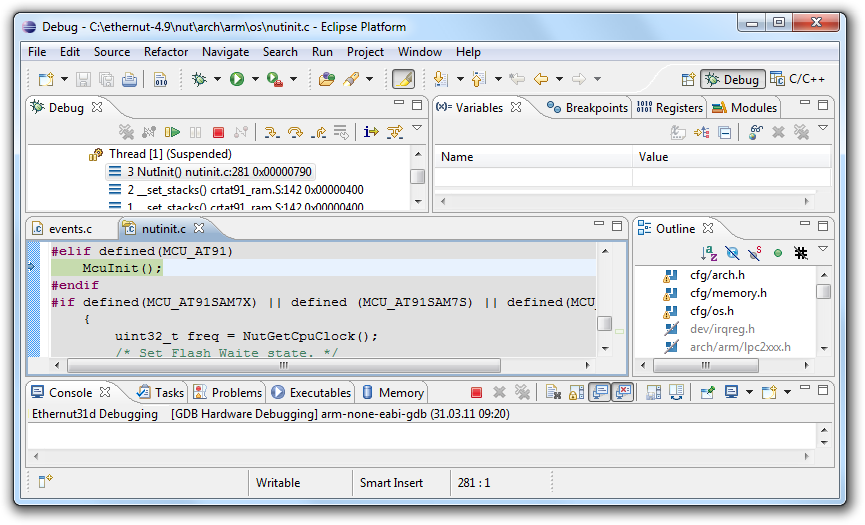
The code will be downloaded to the target and started. Then it stops at the first breakpoint at
the beginning of NutInit. Press F8 or click the Resume button
 .
.
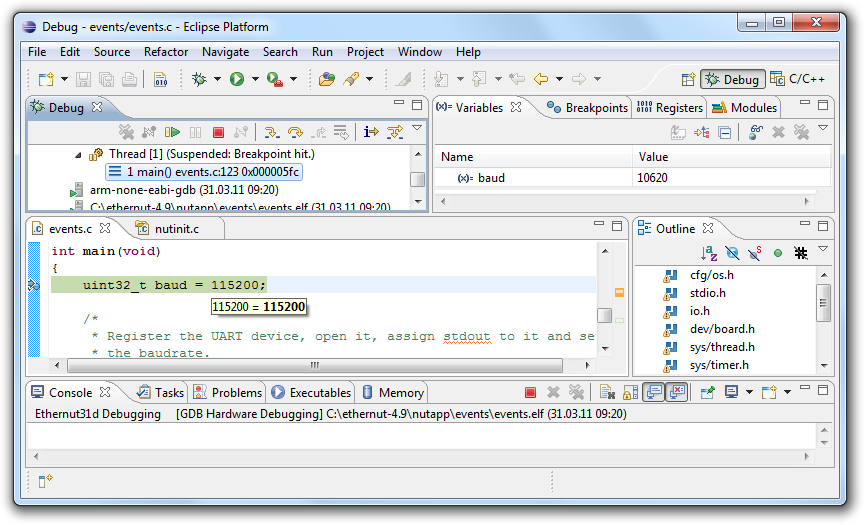
The target code will run up to the next breakpoint in main. You can now press F5 or
click the button
 to step execute a single line, F6 or click the button
 to step over a function call.
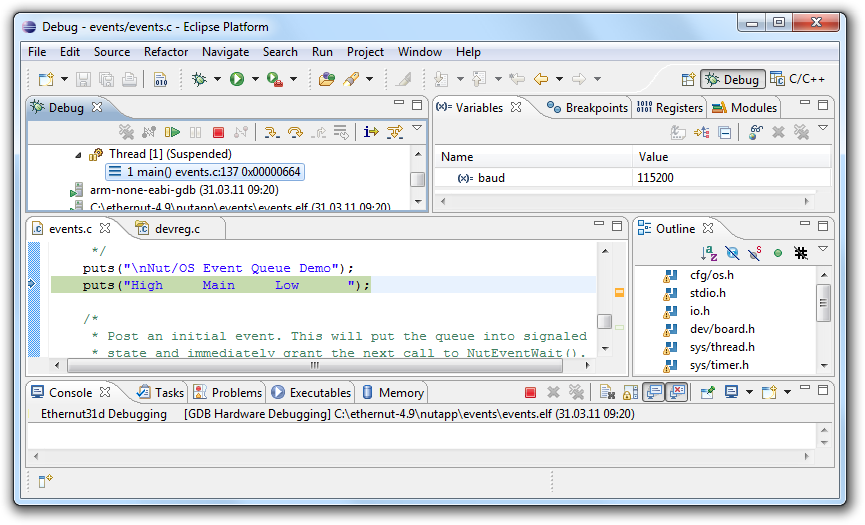
Now continue pressing F6 until we stepped over the first puts() function call.

When this statement has been executed, the text Nut/OS Event Queue Demo should appear in the terminal emulator window.
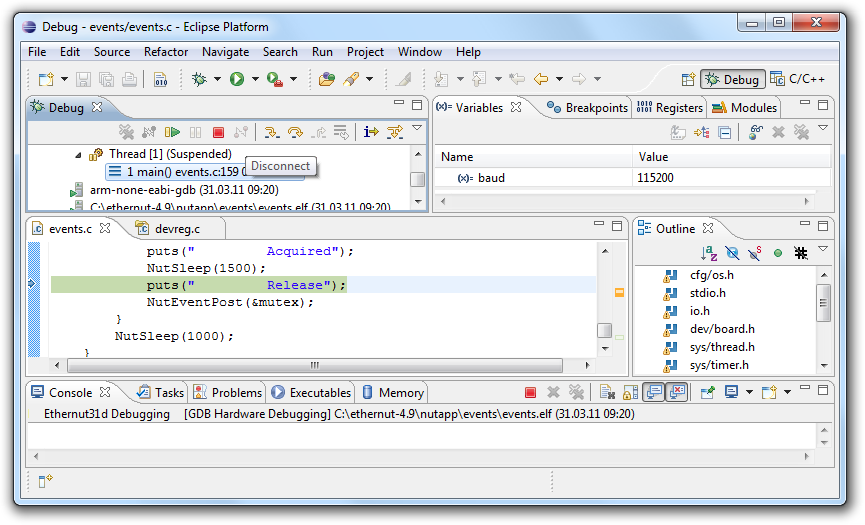
As you continue stepping through the main loop...
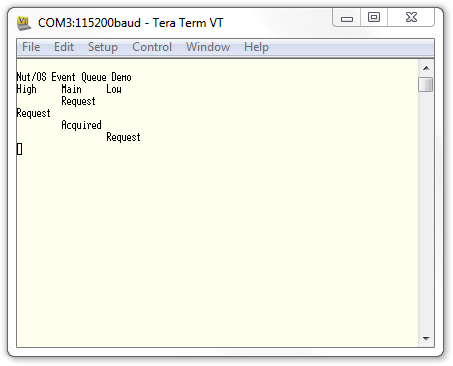
...additional output appears on the serial port.
You may set additional breakpoints, evaluate variables or memory areas and do many other useful things during debugging. Please refer to the Eclipse documentation for further details.