

Configuring Eclipse for JTAG Debugging
It's assumed, that you successfully installed Eclipse and configured the build environment.
The Eclipse IDE can use the GNU Debugger to set breakpoints on specific source code lines, single step line by line, jump in to or out of functions, display variable contents and more. To debug the firmware directly on the target system, we will use OpenOCD with the Turtelizer JTAG debugger.
Setting up the Hardware
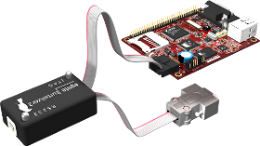
The 10-pin JTAG plug of the Turtelizer 2 directly fits into the JTAG connector of the Ethernut 3 board. Please check the hardware manual regarding the correct JTAG jumper settings.

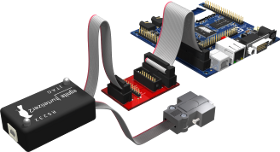
Most ARM boards however provide a 20-pin connector, like Ethernut 5 or the Elektor Internet Radio. An adapter is required to connect the Turtelizer 2 to these boards.
OpenOCD Configuration
The Turtelizer package comes with ready-to-run configuration files for Ethernut 3, Ethernut 5 and the Elektor Internet Radio. It is available from egnite's website. Click on the tab Resources.
A separate document explains the details about configuring OpenOCD for Ethernut 5.
Enable GDB Hardware Debugging in Eclipse
Open the Run menu in the C/C++ perspective and select Debug Configurations...

In the left panel click on GDB Hardware Debugging to activate it. Then click on the New button to create a configuration. A new debug configuration dialog should appear.
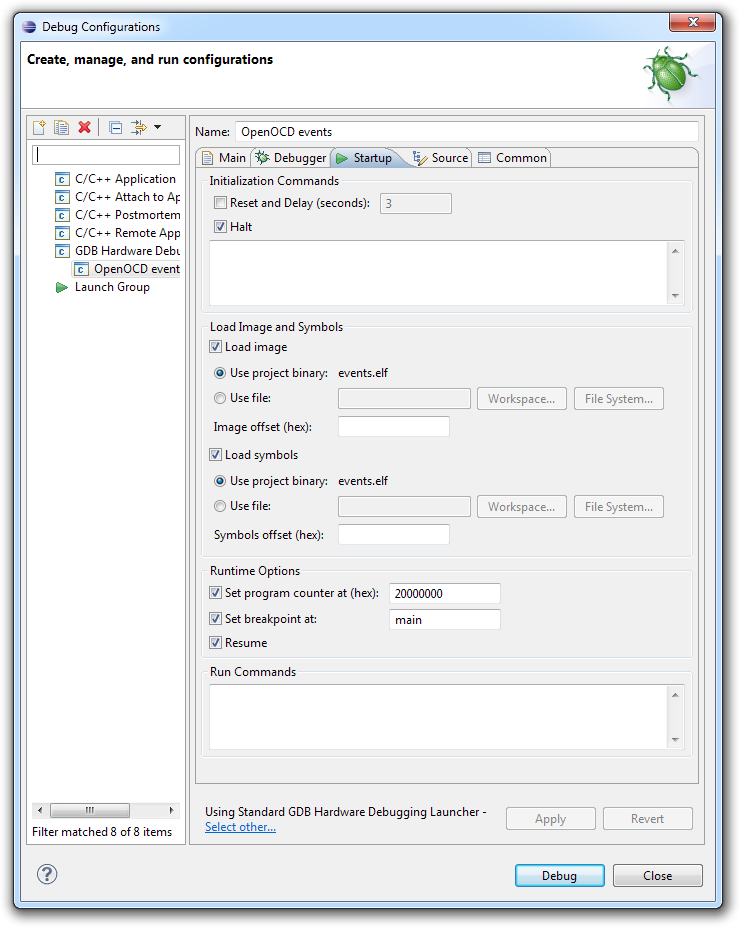
On the Main page, you may enter a meaningful name.

If the Project entry field is empty, click on Browse... and select the project you want to debug. The C/C++ Application field will be set automatically with the related Elf file.
You may Disable auto build to avoid rebuilding the binary with possibly wrong settings. Better use Project -> Build All in the main menu each time you changed the source code.
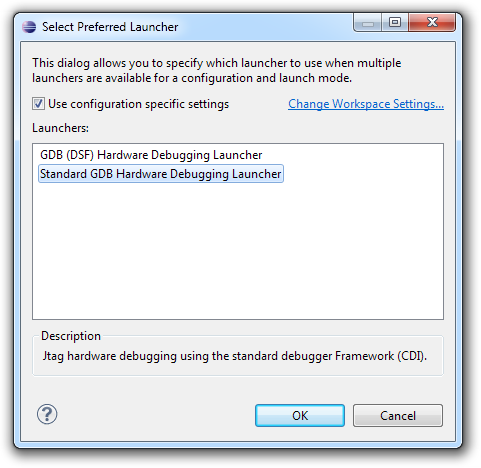
Make sure, that the Standard GDB Hardware Debugging Launcher is selected. If not, click on Select other... to change it in the following dialog. For some reason the Debugger Services Framework doesn't seem to work with OpenOCD.
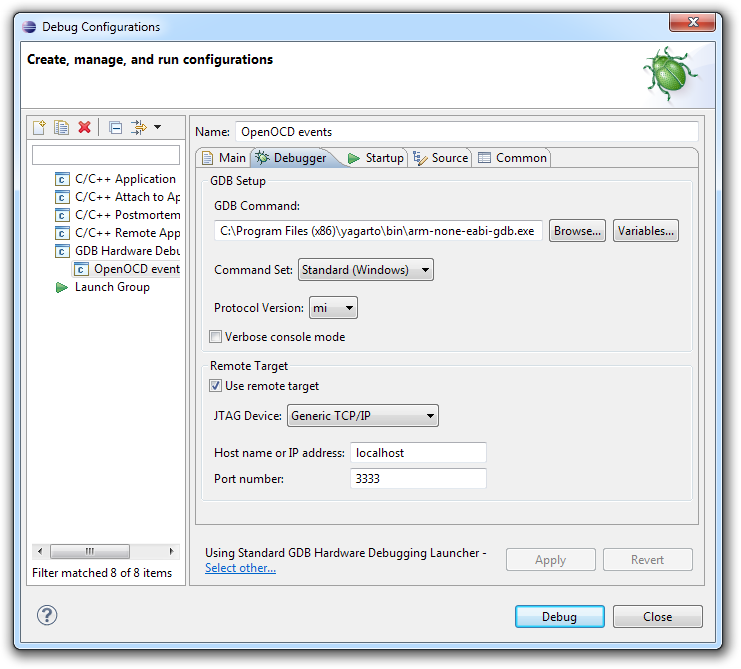
Click on the Debugger tab to activate the related page and click the Browse... button to locate the GNU debugger executable. When using YAGARTO, you should find the executable arm-none-eabi-gdb in the bin directory.
For OpenOCD the TCP port is 3333.
On the Startup page you may disable Reset and Delay when debugging in applications in SDRAM. In some case, the application code may not start at address zero and you need to specify an explicit value. For example, on Ethernut 5 SDRAM starts at 0x20000000.
Often Resume needs to be enabled too.
To test your settings, open a new command line window and start OpenOCD. To debug Ethernut 5 with OpenOCD on a Windows PC, you can use
openocd -s c:/ethernut/nut/tools/turtelizer2
        -c "source [find interface/turtelizer2.cfg]"
        -c "source [find board/ethernut5.cfg]"
        -c init
        -c "reset init"
        -c halt
Put all into a single line. The first three command line options are required to let OpenOCD load the right configuration files. If you are using a different target or JTAG adapter, you have to modify the options accordingly.
The init command is used to move OpenOCD from configuration to running stage. The command reset init will configure the target board. On Ethernut 5 it will mainly setup the PLLs and initialize the SDRAM. Finally a halt is executed to stop the CPU.
If you are not able to get code uploaded and started, you should check the OpenOCD window, possibly increasing the debug level. For more information check this page.
Starting OpenOCD in Eclipse
Instead of running OpenOCD in a separate command line window, you can add it to the Eclipse tools menu to start OpenOCD with a simple click on the tools button. Click on External Tools (the green toolbar button with the tiny toolbox) to open the External Tools Configuration dialog.
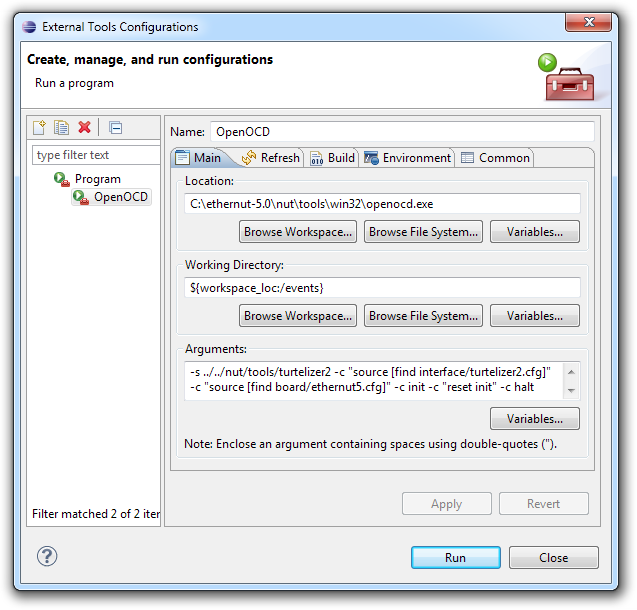
To start OpenOCD select External Tools -> OpenOCD. For reference, here is the OpenOCD console output that appeared on my Windows PC.
Open On-Chip Debugger 0.5.0 (2012-01-21-14:16)
Licensed under GNU GPL v2
For bug reports, read
	http://openocd.berlios.de/doc/doxygen/bugs.html
Info : only one transport option; autoselect 'jtag'
srst_only separate srst_gates_jtag srst_open_drain
trst_and_srst separate srst_gates_jtag trst_push_pull srst_open_drain
adapter_nsrst_delay: 300
jtag_ntrst_delay: 200
RCLK - adaptive
Info : device: 4 "2232C"
Info : deviceID: 67354056
Info : SerialNumber: TLU44E26A
Info : Description: Turtelizer JTAG/RS232 Adapter A
Info : RCLK (adaptive clock speed) not supported - fallback to 3 kHz
Info : JTAG tap: at91sam9260.cpu tap/device found: 0x0792603f (mfg: 0x01f, part: 0x7926, ver: 0x0)
Info : Embedded ICE version 6
Info : at91sam9260.cpu: hardware has 2 breakpoint/watchpoint units
RCLK not supported - fallback to 5 kHz
target state: halted
target halted in ARM state due to debug-request, current mode: System
cpsr: 0x200000df pc: 0x20001068
MMU: disabled, D-Cache: disabled, I-Cache: enabled
Info : JTAG tap: at91sam9260.cpu tap/device found: 0x0792603f (mfg: 0x01f, part: 0x7926, ver: 0x0)
target state: halted
target halted in ARM state due to breakpoint, current mode: Supervisor
cpsr: 0x000000d3 pc: 0x00000000
MMU: disabled, D-Cache: disabled, I-Cache: disabled
RCLK not supported - fallback to 3000 kHz
Warn : NOTE! DCC downloads have not been enabled, defaulting to slow memory writes. Type 'help dcc'.
Warn : NOTE! Severe performance degradation without fast memory access enabled. Type 'help fast'.
Info : accepting 'gdb' connection from 3333
Warn : acknowledgment received, but no packet pending
Note, that Eclipse typically opens several consoles, but only the one of the currently selected program is displayed. Therefore, you need to select C:\Program Files (x86)\yagarto\bin\arm-none-eabi-gdb.exe to get the output of the debugger. My output on the related GDB console was
symbol-file C:\\ethernut-5.0\\nutapp-enut50f-dbg\\events\\events.elf
set $pc=0x20000000
continue

Temporary breakpoint 1, main () at events.c:123
123	    uint32_t baud = 115200;
Solving OpenOCD and GDB Problems
If you can't get the debugger running, check your configuration again. If everything seems to be set up right and it still doesn't work, you best try OpenOCD and GDB outside of Eclipse on the command line.
Start OpenOCD first. On Windows open a command line, make sure that openocd.exe is reachable by your PATH and enter the following, on a single line:
openocd -s c:/ethernut/nut/tools/turtelizer2 -c "source [find interface/turtelizer2.cfg]"
        -c "source [find board/ethernut5.cfg]" -c init -c "reset init" -c halt
Check that the following lines appear. If not, then something might be wrong with your hardware.
Info : device: 4 "2232C"
Info : deviceID: 67354056
Info : SerialNumber: TLU44E26A
Info : Description: Turtelizer JTAG/RS232 Adapter A
Info : RCLK (adaptive clock speed) not supported - fallback to 3 kHz
Info : JTAG tap: at91sam9260.cpu tap/device found: 0x0792603f (mfg: 0x01f, part: 0x7926, ver: 0x0)
Info : Embedded ICE version 6
Info : at91sam9260.cpu: hardware has 2 breakpoint/watchpoint units
On a second command line window we need the YAGARTO bin directory in our PATH. Enter
arm-none-eabi-gdb events.elf
and, after GDB started, enter
target remote localhost:3333
load
This should upload the binary (events.elf in our example) to the target board. For Ethernut 5 the code is loaded into external RAM, which starts at address 0x20000000. Set the program counter accordingly.
set $pc=0x20000000
The C runtime initialization is located here and we use stepi for single stepping.
stepi
To repeat the command, simply press enter. To set a breakpoint on the start of our application's main() routine, enter
break main
and
continue
to let the program run until that point.